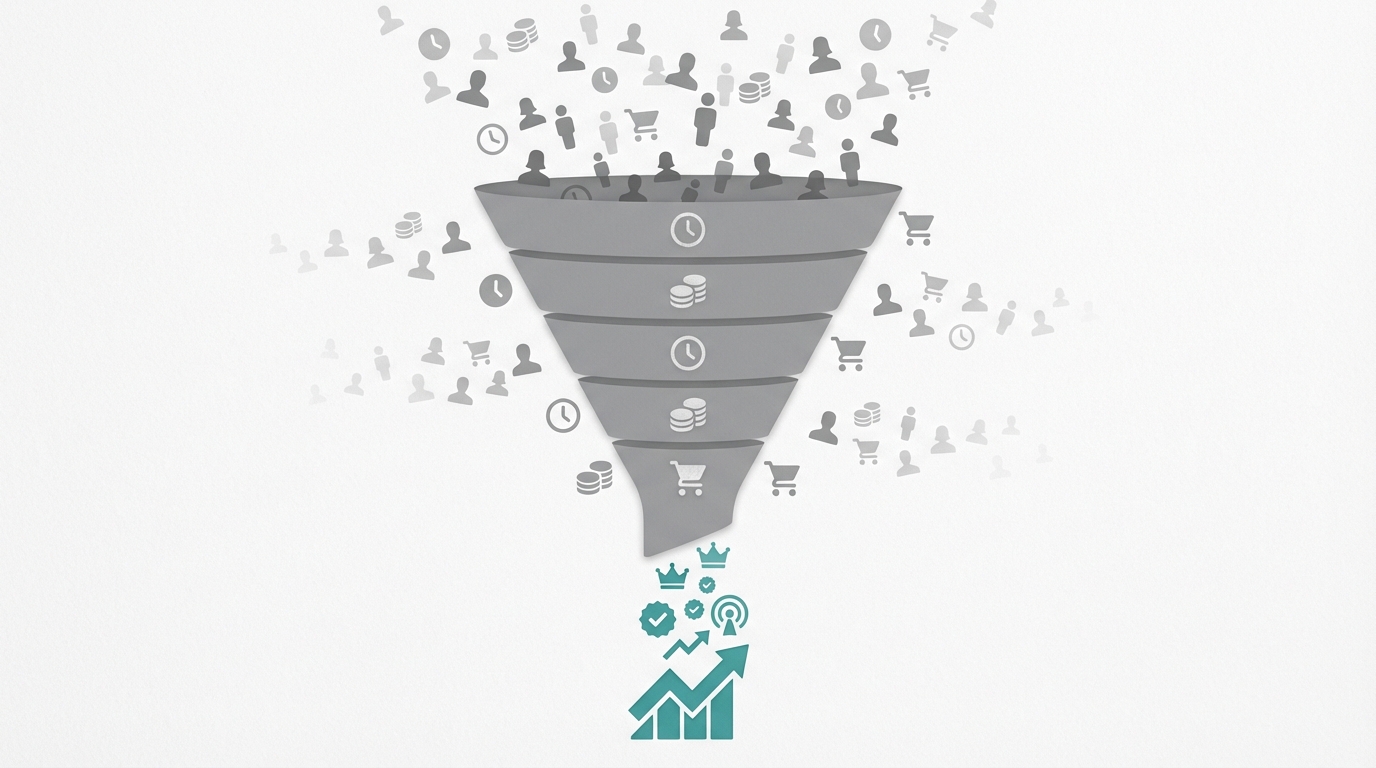
The Conversion Problem at Scale
97–98% of store visitors leave without buying. Cart abandonment sits at 70%+, mobile conversion runs 50% below desktop, and every visitor receives an identical experience regardless of intent.
The typical e-commerce reality:
- 97–98% of visitors don't convert
- Cart abandonment rate: 70%+
- Mobile conversion 50% lower than desktop
- Same experience for everyone
Traditional CRO improves results—through A/B testing, copy improvements, and UX fixes. It is slow, manual, and treats every visitor identically.
Traditional CRO vs. AI-Powered CRO
Traditional Approach
How it works:
- Form hypothesis
- Design variant
- Run A/B test (2–4 weeks)
- Analyze results
- Implement winner
- Repeat
Limitations:
- Tests one variable at a time
- Same experience for all visitors
- Slow iteration cycles
- Human bandwidth bottleneck
AI-Powered CRO
How it works:
- AI analyzes visitor behavior patterns
- Generates multiple personalized variants
- Tests simultaneously across segments
- Learns and adapts in real-time
- Optimizes automatically
Advantages:
- Personalized at individual level
- Dozens of variants tested simultaneously
- Real-time optimization
- Compounds learnings over time
AI Personalization: Right Message, Right Time
Visitor Signal Processing
AI processes more than 200 distinct visitor signals across 3 signal categories to determine the optimal experience in under 50ms.
Behavioral signals:
- Pages visited
- Time on site
- Scroll depth
- Click patterns
- Previous sessions
Contextual signals:
- Traffic source
- Device type
- Location
- Time of day
- Weather
Historical signals:
- Purchase history
- Browse history
- Email engagement
- Support interactions
Real-Time Personalization Examples
| Visitor Type | Signal | Personalization |
|---|
| Returning browser | Viewed product 3x | Show urgency + social proof |
| Cart abandoner | Left with items | Display discount + saved cart |
| New visitor from Facebook | First visit, cold | Show education + trust signals |
| Loyal customer | 5+ purchases | VIP offer + new arrivals |
| Price-sensitive | Sorted by price | Highlight deals + value |
Dynamic Landing Pages
Beyond Static Pages
Static landing pages deliver 1 experience to 100% of traffic regardless of source, device, or intent. AI-powered landing pages adapt 4 core elements—headline, hero image, social proof, and CTA—to each individual visitor.
Traditional: One landing page for all traffic.
AI-powered: Landing page adapts to each visitor.
Dynamic elements:
- Headlines matched to ad copy
- Hero images matched to interests
- Social proof relevant to visitor segment
- CTAs optimized for conversion likelihood
Implementation Architecture
Visitor arrives
     ↓
AI analyzes signals (50ms)
     ↓
Selects optimal page variant
     ↓
Renders personalized experience
     ↓
Tracks interaction
     ↓
Feeds learning model
Dynamic Page Components
| Component | Static Approach | Dynamic Approach |
|---|
| Headline | One for all | Matched to traffic source |
| Hero image | Generic product | Category visitor browsed |
| Social proof | Random reviews | Reviews from similar customers |
| CTA | "Shop Now" | Personalized based on intent |
| Pricing | Standard display | Urgency/discount if abandoner |
Smart Product Recommendations
Beyond "Customers Also Bought"
AI-optimized recommendations increase revenue per visitor by 15–25%, versus 3–5% from basic collaborative filtering (Shopify Partner Report). AI recommendations process 4 purchase-likelihood dimensions and 4 business-rule layers simultaneously.
Purchase likelihood:
- Individual propensity scores
- Category affinity
- Price sensitivity
- Brand preferences
Business rules:
- Inventory levels
- Margin optimization
- Cross-sell priorities
- New product promotion
Recommendation Placements
| Placement | Purpose | AI Optimization |
|---|
| Home page | Discovery | Based on browse history |
| Product page | Alternatives | Comparison shopping behavior |
| Cart | Cross-sell | Complementary + margin |
| Checkout | Last chance | High-conversion items |
| Email | Re-engagement | Abandoned + new matches |
| Recommendation Type | Typical Lift |
|---|
| Basic ("also bought") | +3–5% revenue |
| Personalized | +10–15% revenue |
| AI-optimized | +15–25% revenue |
AI-Powered A/B Testing
The Limits of Traditional A/B Testing
Traditional A/B testing requires 2–4 weeks per test, produces binary winner/loser outcomes, and ignores segment-level variation entirely. These 4 structural constraints cap the number of insights a team generates per quarter.
Problems:
- Takes weeks to reach significance
- Only tests what you think to test
- Binary outcomes (winner/loser)
- Doesn't account for segments
Multi-Armed Bandit Testing
Multi-armed bandit and contextual bandit testing replace static split testing with 2 adaptive approaches that route traffic dynamically and personalize results by segment.
Multi-armed bandit:
- Automatically allocates more traffic to winners
- Reduces "regret" from showing losing variants
- Adapts in real-time
Contextual bandit:
- Considers visitor context
- Different "winners" for different segments
- Truly personalized optimization
Test More, Faster
| Approach | Tests/Month | Time to Insight | Coverage |
|---|
| Manual A/B | 2–4 | 2–4 weeks | Limited |
| AI-assisted | 10–20 | 1–2 weeks | Moderate |
| Full AI | 50+ | Continuous | Comprehensive |
Checkout Optimization with AI
The Checkout Funnel
Checkout abandonment concentrates across 4 friction points that together eliminate 90% of would-be completions before payment.
Typical checkout abandonment points:
- Account creation: 35% drop (require account)
- Shipping info: 20% drop (form friction)
- Shipping cost: 25% drop (sticker shock)
- Payment: 10% drop (trust issues)
AI Checkout Optimization
Dynamic guest checkout:
- Show account creation benefits only to likely converters
- Auto-fill for recognized visitors
- Smart address suggestions
Shipping presentation:
- Show free shipping threshold if close
- Optimize shipping option display
- Personalized delivery estimates
Payment optimization:
- Display preferred payment methods first
- Show trust signals based on hesitation
- Offer payment plans for high-value carts
Measuring Conversion Lift
Key Metrics
AI-powered CRO produces a measurable lift across 4 primary metrics and 4 secondary metrics that together quantify incremental revenue, not just surface-level conversion rate.
Primary metrics:
- Conversion rate (overall and by segment)
- Revenue per visitor
- Average order value
- Micro-conversions (add to cart, wishlist)
Secondary metrics:
- Pages per session
- Time to conversion
- Return visitor conversion
- Mobile vs. desktop gap
Attribution Considerations
Incrementality measurement isolates the true impact of AI features across 4 measurement methods: holdout groups, before/after analysis, segment-level performance, and long-term customer value tracking.
Measure incrementality:
- Holdout groups for AI features
- Before/after analysis
- Segment-level performance
- Long-term customer value impact
Reporting Framework
| Metric | Control | AI-Powered | Lift |
|---|
| Conversion rate | 2.1% | 2.8% | +33% |
| RPV | $3.15 | $4.42 | +40% |
| AOV | $85 | $92 | +8% |
| Cart completion | 28% | 38% | +36% |
Implementation Roadmap
Phase 1: Foundation (Weeks 1–4)
A 4-week foundation phase installs tracking infrastructure and identifies the top 3–5 optimization opportunities before any AI feature goes live.
Setup:
- Install tracking and analytics
- Configure data collection
- Establish baseline metrics
- Identify key optimization areas
Quick wins:
- Basic personalization rules
- Exit intent popups
- Social proof widgets
- Cart abandonment emails via Klaviyo or Omnisend
Phase 2: AI Activation (Weeks 5–8)
Weeks 5–8 activate 4 AI-powered systems — product recommendations, dynamic content blocks, AI-powered A/B testing, and checkout optimization — with each measured against the Phase 1 baseline.
Implement:
- Product recommendations
- Dynamic content blocks
- AI-powered A/B testing
- Checkout optimization
Measure:
- A/B test AI features
- Monitor performance metrics
- Gather qualitative feedback
- Identify issues
Phase 3: Scale (Weeks 9–12)
Weeks 9–12 expand the personalization engine to full cross-channel coverage across email flows in Klaviyo, SMS sequences in Attentive or Postscript, and on-site loyalty triggers via Yotpo.
Expand:
- Full personalization engine
- Advanced segment targeting
- Cross-channel consistency
- Continuous optimization
Optimize:
- Refine AI models
- Expand test coverage
- Integrate learnings
- Scale successes
Phase 4: Continuous (Ongoing)
- Daily monitoring
- Weekly optimization reviews
- Monthly strategy adjustments
- Quarterly goal setting
Investment Considerations
DIY Approach
The DIY approach requires $300–1,000/month in tools across a personalization platform, A/B testing tool such as Google Optimize or VWO, and an analytics platform — plus dedicated development resources.
Tools needed:
- Personalization platform ($200–500/month)
- A/B testing tool ($100–300/month)
- Analytics platform ($0–200/month)
- Development resources
Timeline: 3–6 months to full implementation
Best for: Teams with technical resources
Done-For-You
The done-for-you approach launches in 4–8 weeks and includes strategy, tool selection, ongoing optimization across platforms like Gorgias and Recharge, and weekly performance reporting.
What's included:
- Strategy and implementation
- Tool selection and setup
- Ongoing optimization
- Performance reporting
Timeline: 4–8 weeks to launch
Best for: Revenue-focused brands wanting faster results
Next Steps
Every 0.1% increase in conversion rate is direct profit with zero additional ad spend. AI-powered CRO — through tools like Klaviyo, Yotpo, and Omnisend — delivers that improvement 10x faster than manual testing (Klaviyo 2025 Email Benchmark Report).
- Book a strategy call to assess your CRO opportunity
- Read: Landing Page Optimization
- Learn: Checkout Optimization Guide
- Explore: A/B Testing for E-Commerce