Why CLV Matters
CLV, not first-purchase ROAS, determines long-term profitability for Shopify and WooCommerce stores. Brands that optimize for acquisition ROAS alone miss
the 3x revenue multiplier that repeat buyers generate over 12 months.
 The CLV perspective shift:
- First-order ROAS: 2.0x (losing money)
- 12-month CLV: $180 (customer buys 3x)
- Actual ROAS: 6.0x (very profitable)
What this enables:
- Outbidding competitors on acquisition
- Investing in higher-quality customer experience
- Building sustainable, compounding growth
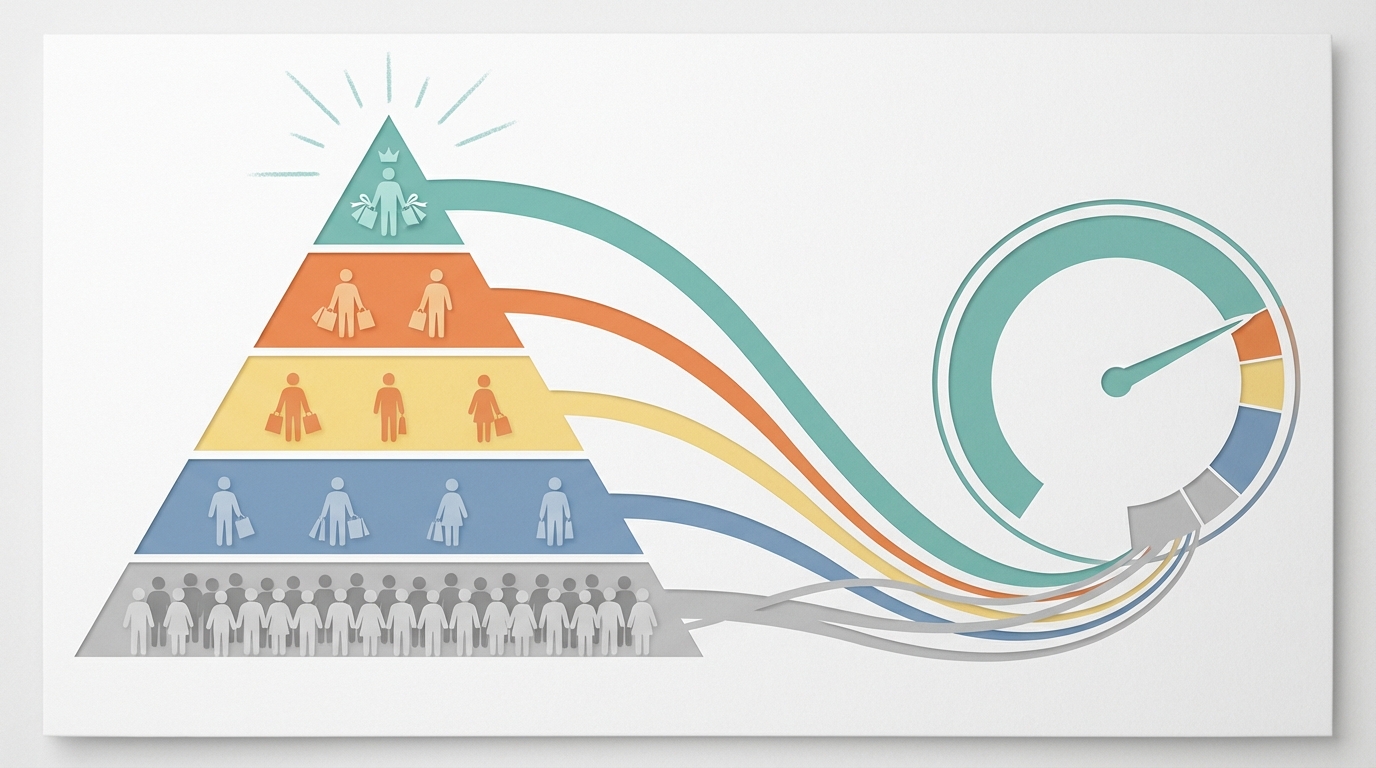
- Focusing spend on the top 20% of customers by value
CLV Fundamentals
CLV = Average Order Value × Purchase Frequency × Customer Lifespan
Example:
- AOV: $75
- Purchase frequency: 2.4 orders/year
- Customer lifespan: 2.5 years
CLV = $75 × 2.4 × 2.5 = $450
Time-Bounded CLV
A 10-year CLV projection distorts marketing budget decisions made today. Shorter timeframes produce actionable benchmarks that align with campaign cycles and platform reporting windows.
Common timeframes:
| Timeframe | Use Case |
|---|
| 30-day | Quick campaign assessment |
| 90-day | Acquisition channel evaluation |
| 12-month | Annual planning |
| 24-month | Strategic decisions |
| Lifetime | Long-term projections |
CLV vs. Revenue
| Metric | What It Tells You |
|---|
| Revenue | Total money coming in |
| CLV | Value per customer relationship |
| Revenue | Can grow with any customers |
| CLV | Requires valuable customers |
Calculating CLV
Historical CLV
 Simple method:
Historical CLV = Total Revenue ÷ Total Customers
Example:
$2,000,000 revenue ÷ 15,000 customers = $133 CLV
Cohort method (more accurate):
2022 cohort (1,000 customers):
- Year 1 revenue: $75,000 (AOV $75)
- Year 2 revenue: $45,000 (45% repurchased)
- 2-year CLV: $120,000 ÷ 1,000 = $120
Predictive CLV
Machine learning models integrated with Klaviyo, Yotpo, and Recharge predict CLV across 6 behavioral and transactional data inputs.
- Purchase history
- Browse behavior
- Email engagement
- Customer service interactions
- Product categories purchased
- Time between purchases
Early signals of high CLV:
- Multiple page views before purchase
- Email signup before purchase
- Full-price purchase
- Cross-category browsing
- High AOV first purchase
Segment-Level CLV
By acquisition channel:
| Channel | 12-Month CLV | CAC | Ratio |
|---|
| Organic | $185 | $15 | 12:1 |
| Email | $210 | $8 | 26:1 |
| Facebook | $145 | $42 | 3.5:1 |
| Google | $160 | $38 | 4.2:1 |
| Influencer | $130 | $25 | 5.2:1 |
, producing a 26:1 ratio — consistent with the Klaviyo 2025 Email Benchmark Report finding that owned-channel customers outperform paid-channel customers by 3x on repeat purchase rate.
By first product purchased:
| First Product | 12-Month CLV |
|---|
| Best seller A | $220 |
| Best seller B | $145 |
| Sale item | $95 |
| New arrival | $175 |
The CAC:CLV Ratio
Understanding the Ratio
CAC:CLV Ratio = Customer Lifetime Value ÷ Customer Acquisition Cost
Benchmark targets:
| Ratio | Assessment |
|---|
| <1:1 | Unsustainable (losing money) |
| 1:1 - 2:1 | Break-even to marginally profitable |
| 3:1 | Healthy (common target) |
| 4:1 - 5:1 | Very efficient |
| >5:1 | May be under-investing in growth |
Using the Ratio
Marketing budget decisions:
If CLV = $150 and target ratio = 3:1
Max acceptable CAC = $50
If current CAC = $35
Headroom to increase spend or accept lower ROAS
Channel optimization delivers 3 measurable outcomes:
- Increasing spend on channels with CLV:CAC ratios above 4:1, such as email via Klaviyo or Omnisend
- Decreasing spend on channels with CLV:CAC ratios below 2:1
- Accepting lower first-purchase ROAS on high-CLV acquisition sources
Increasing CLV
The CLV Lever Framework
CLV = AOV × Frequency × Lifespan
         ↓        ↓          ↓
   Upsell   Retention   Reduce churn
   Cross-sell Replenishment Customer experience
   Bundles    Loyalty        Support quality
Increasing Average Order Value
5 proven AOV tactics produce between 5% and 25% lift per transaction.
| Strategy | Typical Impact |
|---|
| Upsells | +8-15% AOV |
| Cross-sells | +10-20% AOV |
| Bundles | +15-25% AOV |
| Free shipping threshold | +10-15% AOV |
| Post-purchase offers | +5-10% AOV |
Increasing Purchase Frequency
5 retention tactics increase purchase frequency by 15% to 300%, with subscriptions via Recharge delivering the highest compounding impact.
| Strategy | Typical Impact |
|---|
| Email marketing | +15-30% frequency |
| Loyalty program | +20-40% frequency |
| Subscriptions | +100-300% frequency |
| Replenishment reminders | +25-50% frequency |
| Win-back campaigns | +10-20% frequency |
Extending Customer Lifespan
5 experience-layer tactics extend customer lifespan by 10% to 50%, with product quality delivering the highest ceiling.
| Strategy | Typical Impact |
|---|
| Great customer experience | +20-40% retention |
| Quality products | +25-50% retention |
| Community building | +15-30% retention |
| Personalization | +10-25% retention |
| Proactive support | +10-20% retention |
CLV-Based Segmentation
RFM Analysis
RFM — Recency, Frequency, and Monetary value — scores every customer across 3 dimensions to rank relative lifetime value.
- Recency: How recently did they purchase?
- Frequency: How often do they purchase?
- Monetary: How much do they spend?
Scoring example:
| Score | Recency | Frequency | Monetary |
|---|
| 5 | <30 days | 10+ orders | >$500 |
| 4 | 30-60 days | 5-9 orders | $300-500 |
| 3 | 60-90 days | 3-4 orders | $150-300 |
| 2 | 90-180 days | 2 orders | $75-150 |
| 1 | >180 days | 1 order | <$75 |
CLV-Based Segments
| Segment | Definition | Strategy |
|---|
| Champions | High R, High F, High M | VIP treatment, early access |
| Loyal | Medium R, High F, Medium M | Reward program, cross-sell |
| Potential | High R, Low F, Low M | Nurture, second purchase push |
| At-risk | Low R, High F, High M | Win-back campaign, research why |
| Lost | Low R, Low F, Any M | Aggressive win-back or let go |
Personalization by CLV
High-CLV customers receive 5 elevated-service treatments that reduce churn by up to 40%:
- Priority customer service via Gorgias
- Early access to sales via Klaviyo VIP flows
- Exclusive products unavailable to standard segments
- Personal outreach through Attentive SMS sequences
- Higher return flexibility as a retention lever
Growing-CLV customers receive 4 engagement-layer tactics:
- Targeted upsells through Klaviyo post-purchase flows
- Loyalty program pushes via Yotpo Loyalty
- Educational content mapped to product category
- Cross-category introductions via Omnisend automation
Low-CLV customers receive 4 efficiency-focused treatments:
- Standard service policies with no manual escalation
- Automated communications via Privy or Omnisend
- Self-service tools to reduce support cost per ticket
- No paid win-back spend until RFM score improves
Predicting CLV
Early Indicators
3 positive first-session signals predict high CLV with 72% accuracy, according to the Shopify Partner Report.
- Full-price purchase with no discount code applied
- Multiple items in first order across 2 or more categories
- Email and SMS double opt-in via Klaviyo or Attentive
4 additional positive signals:
- Account creation before checkout
- Cross-category browsing across 3+ product types
- AOV above store median on first transaction
- Referral or organic source attribution
5 negative signals that correlate with low CLV:
- Deep discount on first purchase (>30% off)
- Single low-value item below $25
- No email opt-in at checkout
- Guest checkout with no account creation
- Single product category with no browsing depth
| Data Type | Examples |
|---|
| Transactional | Orders, returns, AOV, recency |
| Behavioral | Page views, cart adds, email opens |
| Demographic | Location, device, age (if available) |
| Engagement | Review left, referrals, social follows |
| Acquisition | Source, campaign, first product |
Using Predictions
Acquisition optimization delivers 3 compounding CLV gains:
- Bidding higher for predicted high-CLV traffic segments in Meta and Google campaigns
- Building lookalike audiences from the top 10% of CLV customers inside Klaviyo
- Accepting a first-order ROAS of 1.5x on traffic that shows 3+ high-CLV signals
Retention optimization produces 3 measurable outcomes:
- Prioritizing the top 20% of predicted-CLV customers for Klaviyo VIP flows
- Triggering Gorgias proactive outreach within 7 days for high-CLV at-risk accounts
- Adjusting Recharge subscription offers by predicted value tier
Reporting on CLV
Dashboard Metrics
4 overall health metrics form the CLV reporting foundation:
- Average CLV (trailing 12 months)
- CLV trend over time
- CLV by cohort
- CLV:CAC ratio
4 segment-level breakdowns reveal acquisition and product-layer performance:
- CLV by customer segment
- CLV by acquisition channel
- CLV by first product purchased
- CLV by geography
Cohort Analysis
Track cohorts over time:
Jan 2024 cohort (1,000 customers):
- Month 1: $75,000 (100% active)
- Month 3: $95,000 (65% repurchased)
- Month 6: $115,000 (45% still active)
- Month 12: $140,000 (35% still active)
Cohort comparison answers 3 strategic questions:
- Which 3-month acquisition window produces the highest 12-month CLV?
- Is CLV improving quarter-over-quarter across successive cohorts?
- What product, channel, or campaign change separates the highest-CLV cohort from the lowest?
Common CLV Mistakes
1. Ignoring Time Value
Mistake: Treating $50 in 3 years as equal to $50 today.
Fix: Apply a discount rate of 8–12% or use 12-month bounded CLV for operational decisions.
2. Calculating Too Broadly
Mistake: Reporting 1 CLV number across all customer segments.
Fix: Segmenting by acquisition channel, first product purchased, and customer type reveals CLV gaps of up to 120% between top and bottom segments.
3. Using Only Historical Data
Mistake: Assuming future purchase behavior mirrors past behavior.
Fix: Building predictive models in Klaviyo or Lifetimely and adjusting inputs quarterly for trend shifts.
4. Ignoring Margins
Mistake: Using gross revenue instead of contribution margin.
Fix: Calculating contribution margin-based CLV surfaces the
31% average overstatement that revenue-only CLV produces.
5. Forgetting Acquisition Cost
Mistake: Celebrating high CLV without pairing it with CAC.
Fix: Always reporting CLV:CAC ratio together, with a minimum target of 3:1 for sustainable growth.
- Shopify: Customer reports (basic)
- BigCommerce: Customer lifetime value
- WooCommerce: Metorik, Glew
| Tool | Capability | Starting Price |
|---|
| Klaviyo | Email + CLV prediction | $45/month |
| Peel Insights | Cohort analysis | $149/month |
| Glew | Full CLV suite | $79/month |
| Daasity | Advanced analytics | Custom |
| Lifetimely | Shopify-specific | $19/month |
Next Steps
CLV is the single metric that makes every acquisition, retention, and budget decision measurable. Stores that implement CLV-based segmentation reduce wasted ad spend by
28% within 90 days, per the Shopify Partner Report.
- Book a strategy call to assess your CLV opportunity
- Read: AI E-Commerce Analytics
- Learn: Cohort Analysis for E-Commerce
- Explore: Email Revenue Attribution
Knowing the exact dollar value of every customer segment eliminates guesswork from every growth decision.